Actual Observations
How ForecastWatch Measures Actuals
When I first began researching how ForecastWatch should be designed and built, I talked to many meteorologists. I also searched the web for guidance and information to make ForecastWatch the best product it could be. Most meteorologists told me that one problematic issue was the steadily falling temperature. "Which is more accurate when the temperature is falling all day?", the meteorologists asked: "A forecast that predicts the high for the day at midnight, or one that states a lower high temperature, but occurs in the afternoon, where people expect the high?".
The Problem With Actuals
Actuals reported by all official meteorological organizations are the high and low for the local 24-hour day. Sometimes, especially in winter in the upper two-thirds of the United States, the temperature at midnight is the high for the day. The temperature steadily drops throughout the day, maybe with a slight uptick when the sun passes over. The low for the day occurs at the end of the day.
This is the opposite of what happens on the average day. In the absence of fronts, wind, or other factors, temperatures generally fall when the sun isn't in the sky, and rise when it is. This means that the period around sunrise is the coldest part of the day, and the mid- to late-afternoon is the warmest. And when a forecaster gives us the high and low for the day, we tend to assume that the low is the morning low, and the high is the afternoon high. Imagine the surprise on November 25, 2004 if forecasters gave us highs and lows for the day like the actuals are reported.
November 25, 2004: A Blast From Canada

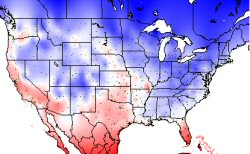
The last bits of a late Indian summer were being pushed east by a large mass of cold air pushing down from Canada. As November 25th began, Pittsburgh was at 60 degrees Fahrenheit, as was Roanoke, Virginia. The temperature map above left shows the temperatures across the United States the first hour of November 25th, Eastern Standard Time. From New York to Florida, temperatures were mild, while the midsection was experiencing the mass of cold air coming down from Canada. Much of Iowa, Wisconsin, and Minnesota was in the 20's.
By the end of the day, the cold air had pushed through to the Atlantic. What a difference! While Pittsburgh was at 60 degrees to start the day, it ended the day at a chilly 27 degrees! The story was similar all the way down the Mid-Atlantic states from New York, Virginia, Georgia, and even parts of Florida. The map at right above shows how the day ended, with the whole eastern third of the country in the grip of cold. Click here to view an animation of the temperature progression for the entire day. If a forecaster had predicted a high temperature of 60 degrees for Pittsburgh on November 25, would he or she have been right?
How Did The Forecasters Do?
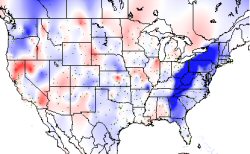
If you would look at the temperature record for Pittsburgh you would see recorded a high temperature of 60 degrees, and a low temperature of 27 degrees. Based on that information alone, you would have calculated that the forecasters predicted temperatures much too cold for the Mid-Atlantic. The bias map on the left shows the calculated average forecast errors using the reported daily high for one-day-out forecasts. The big blue streak down the right side of the map readily shows the extent of the forecasters' "error", where they predicted a high that was much too low. Is this accurate?
If a forecaster predicted a high of 60 degrees for November 25th for Pittsburgh, he or she would have been exactly right. The high temperature for the 24-hour day was 60 degrees. But would a consumer of the weather forecast in Pittsburgh think it was accurate? When he went out in shorts at 3pm thinking it was going to be 60 degrees, he would have had a rude awakening. At that time it was near freezing already. A forecaster who predicted a high around freezing would have been more correct, as that is what the forecast consumer expects. If a high is forecast to be 32 degrees, the consumer knows to bundle up.
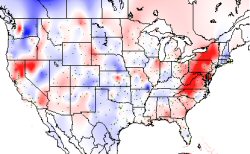
ForecastWatch takes the "afternoon" high temperature into account, and does not just use the reported actual high. The map on the right shows the corrected forecast errors for November 25th. Interestingly, when the afternoon actual high is used, it still seems forecasters missed. In fact, forecasters underestimated the quickness and reach of the blast of cold, and overestimated the effect of solar heating. For example, forecasters predicted a high between 39 and 47 degrees for Pittsburgh, while the afternoon high was actually only 35 degrees. This temperature occured at around 1pm. Still, average high temperature forecast error drops from 3.7 degrees to 3.2 degrees for the entire country on November 25th when the afternoon high is used where appropriate.
ForecastWatch Calculates True Accuracy
There are many subtleties to calculating temperature forecast error. It is not as simple as simply taking the recorded observed high and comparing it to the forecasted temperature. Most of the time it will work, but on days like November 25th, 2004, it would be easy to mischaracterize the forecast error. ForecastWatch aims to provide the highest quality error data, and takes great efforts to ensure that the error data reflects true accuracy.
Stay Connected